Hi, this is CoinFirstStep. The crypto Fear and Greed Index turns the market's mood into one number from 0 to 100: a low number means the market is fearful, and a high number means it's greedy. It describes the mood right now and doesn't tell you what the price will do next, so treat it as one input next to your own plan, not as a buy or sell signal.
This guide explains what the number measures, what each zone means, why the Binance widget can show a different number, and what a full year of real readings looked like.
20% commission rebate
Referral link: you get a 20% commission rebate on your trading fees (disclosure).
At a glance
| What it is | One number from 0 (Extreme Fear) to 100 (Extreme Greed) |
|---|---|
| Best-known version | Alternative.me's index, based on Bitcoin |
| Updated | Alternative.me: once a day. Binance widget: syncs with CoinMarketCap every 15 minutes |
| On Binance | A phone widget with CoinMarketCap's index, which uses different zones |
| Use it for | Checking the market's mood, not timing trades |
1. What the crypto Fear & Greed Index is
The best-known crypto Fear & Greed Index is published by Alternative.me. It looks at Bitcoin's market data and online activity, then combines them into one daily score from 0, the most fearful, to 100, the most greedy. Its daily history goes back to February 2018.
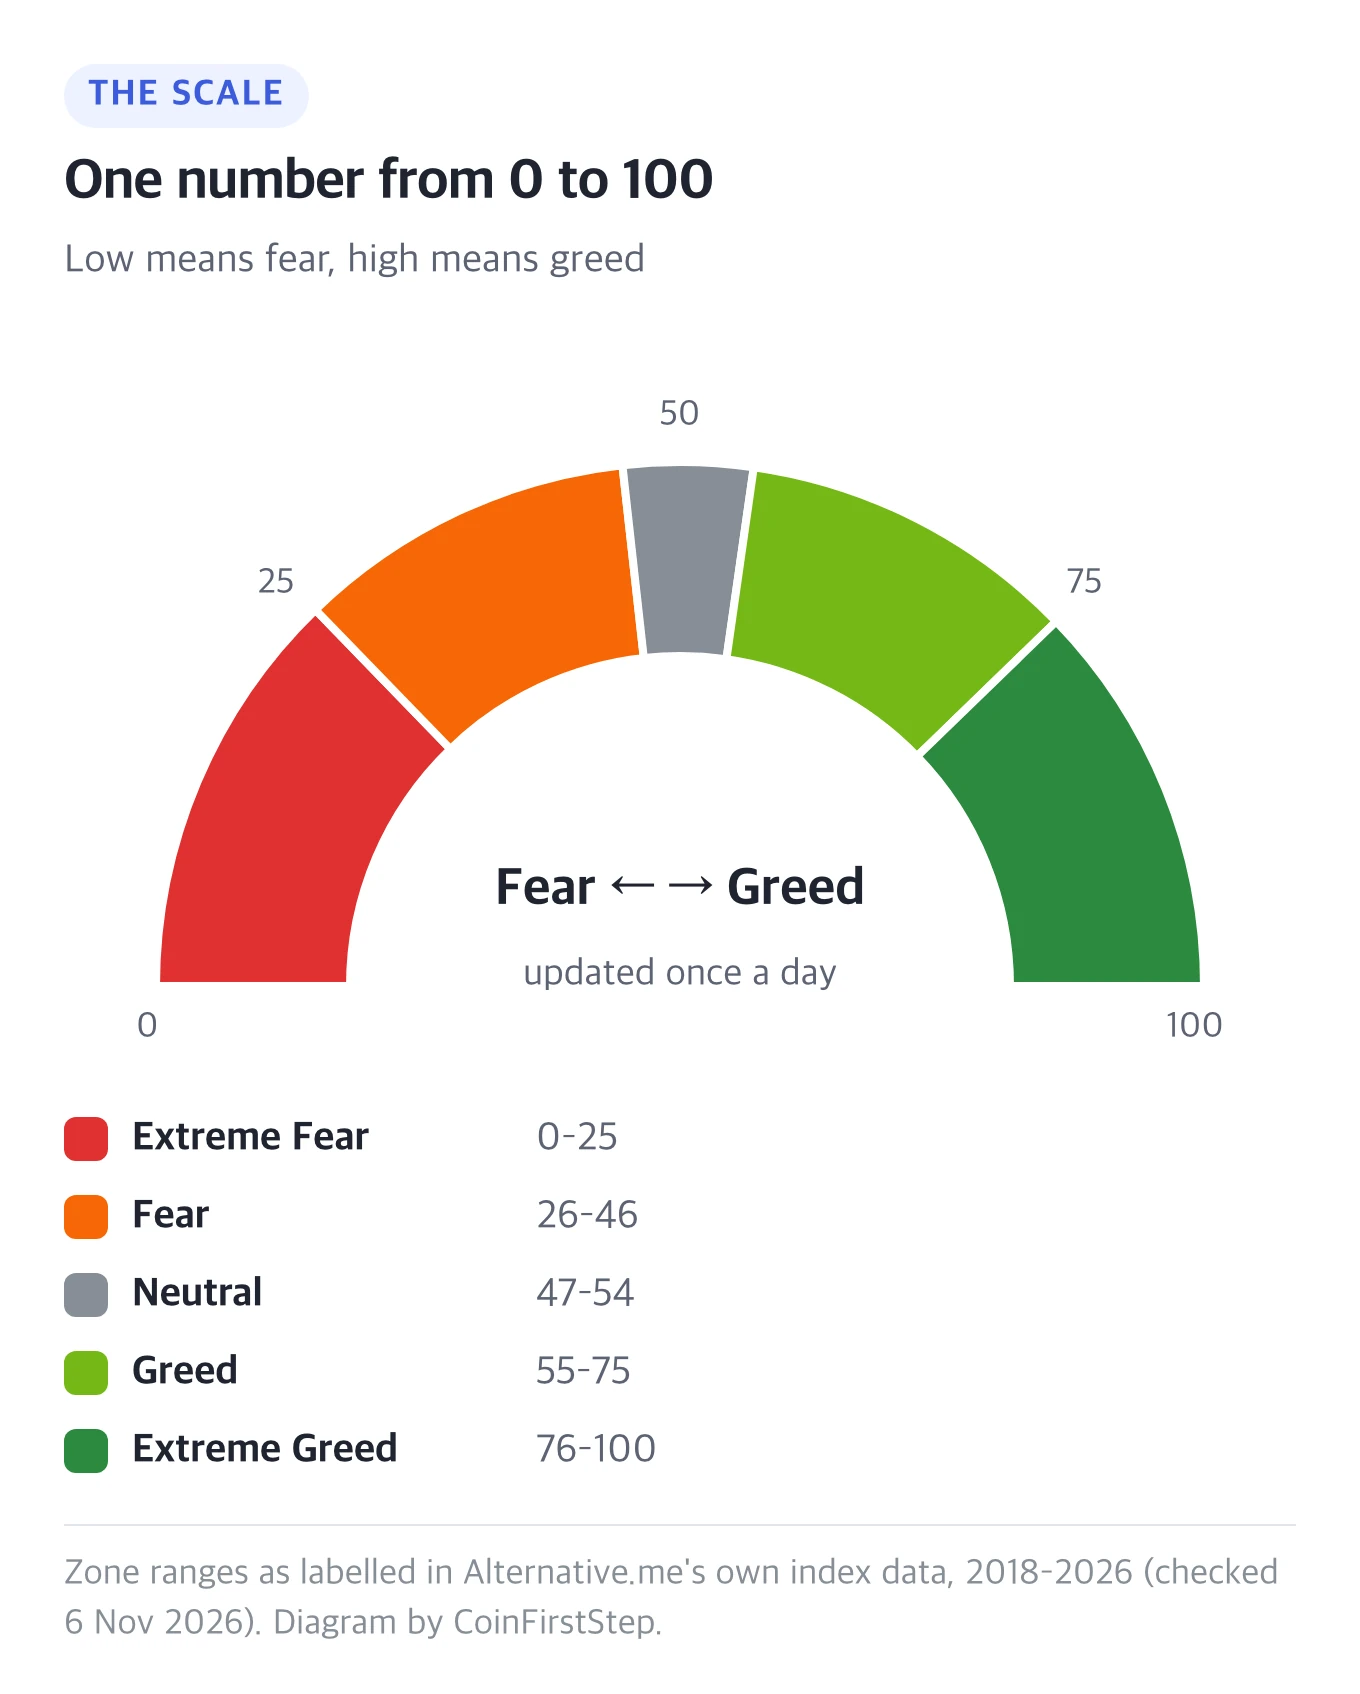
Many people use it as a rough mood check for the wider market, since most coins often move with Bitcoin. Other sites, including CoinMarketCap, publish their own fear and greed indexes, which section 4, Where to check the Fear & Greed Index, compares.
2. The five zones of the Fear & Greed Index
Every score falls into one of five zones. The ranges below are the ones Alternative.me's own data uses for each label (the index page itself shows only the names).
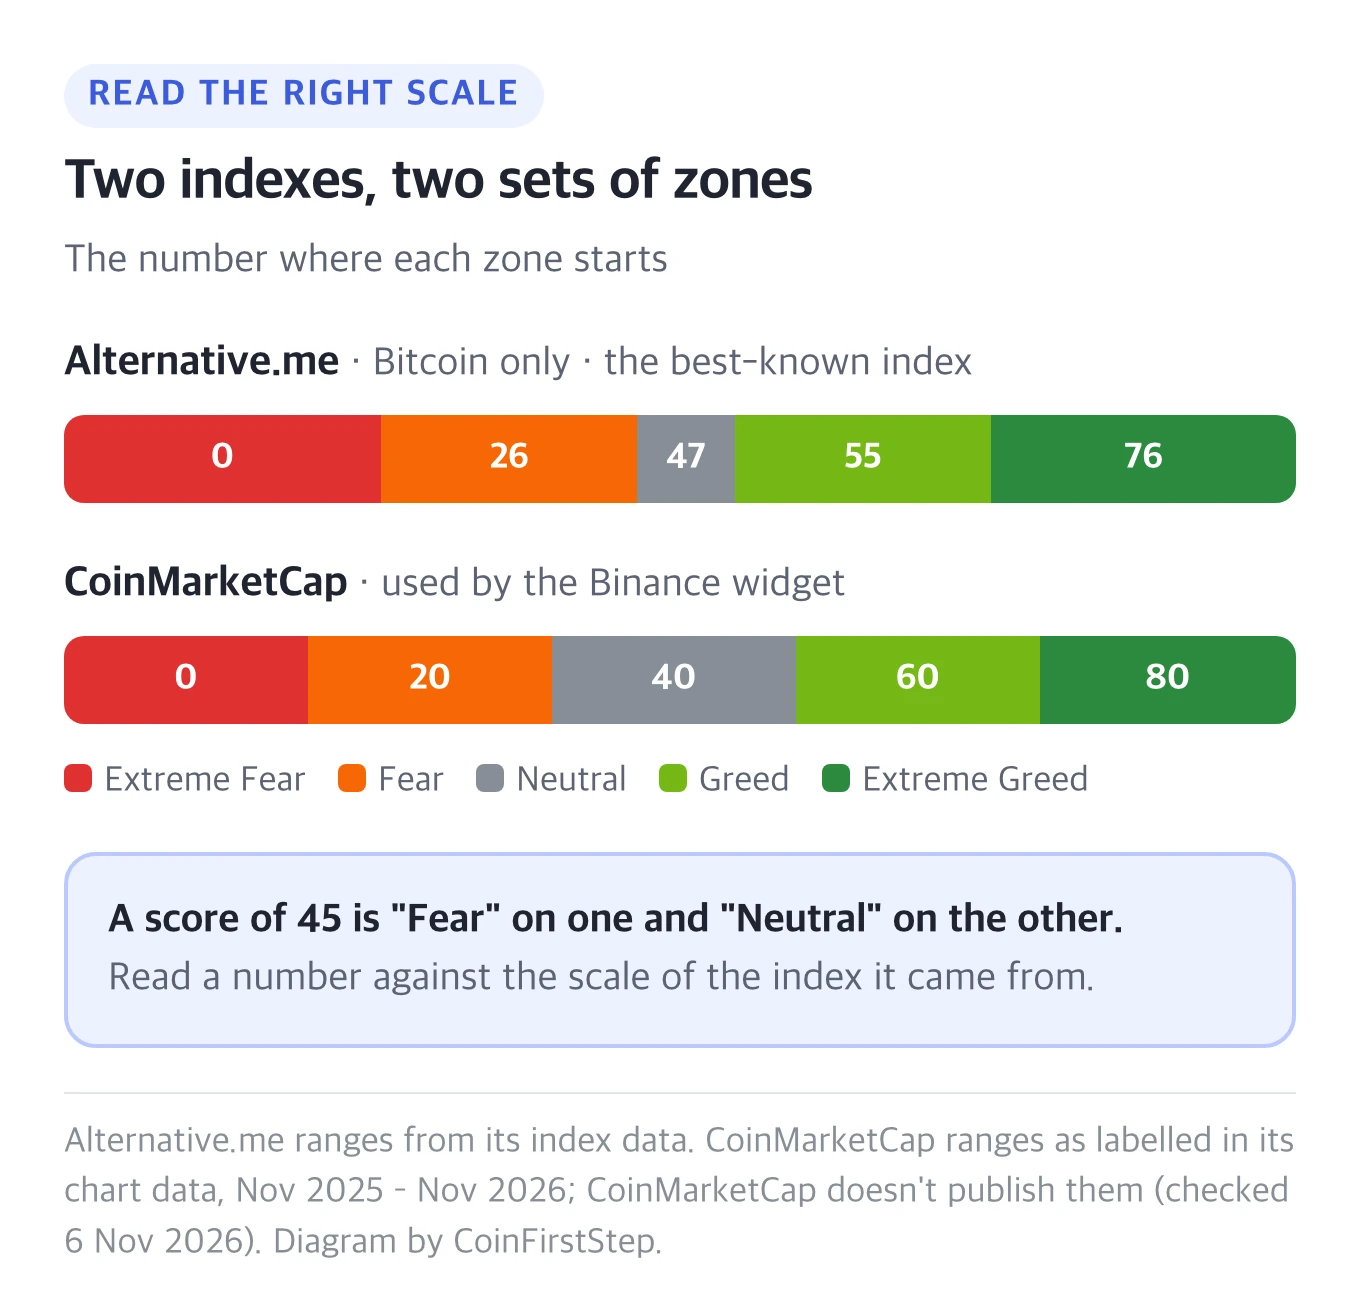
| Extreme Fear | Sharp drops, high volatility, worried online talk |
|---|---|
| Fear | A weak or nervous market |
| Neutral | No strong mood either way |
| Greed | Rising prices and growing interest |
| Extreme Greed | Fast gains and very heavy attention |
▣ Neutral is a narrow band
On Alternative.me, only 47 to 54 counts as Neutral. From November 2025 to November 2026, just 23 of 365 days were Neutral, so watch the direction over several days rather than one day's label.
3. What goes into the Fear & Greed Index
Alternative.me lists six parts and how much each one counts.
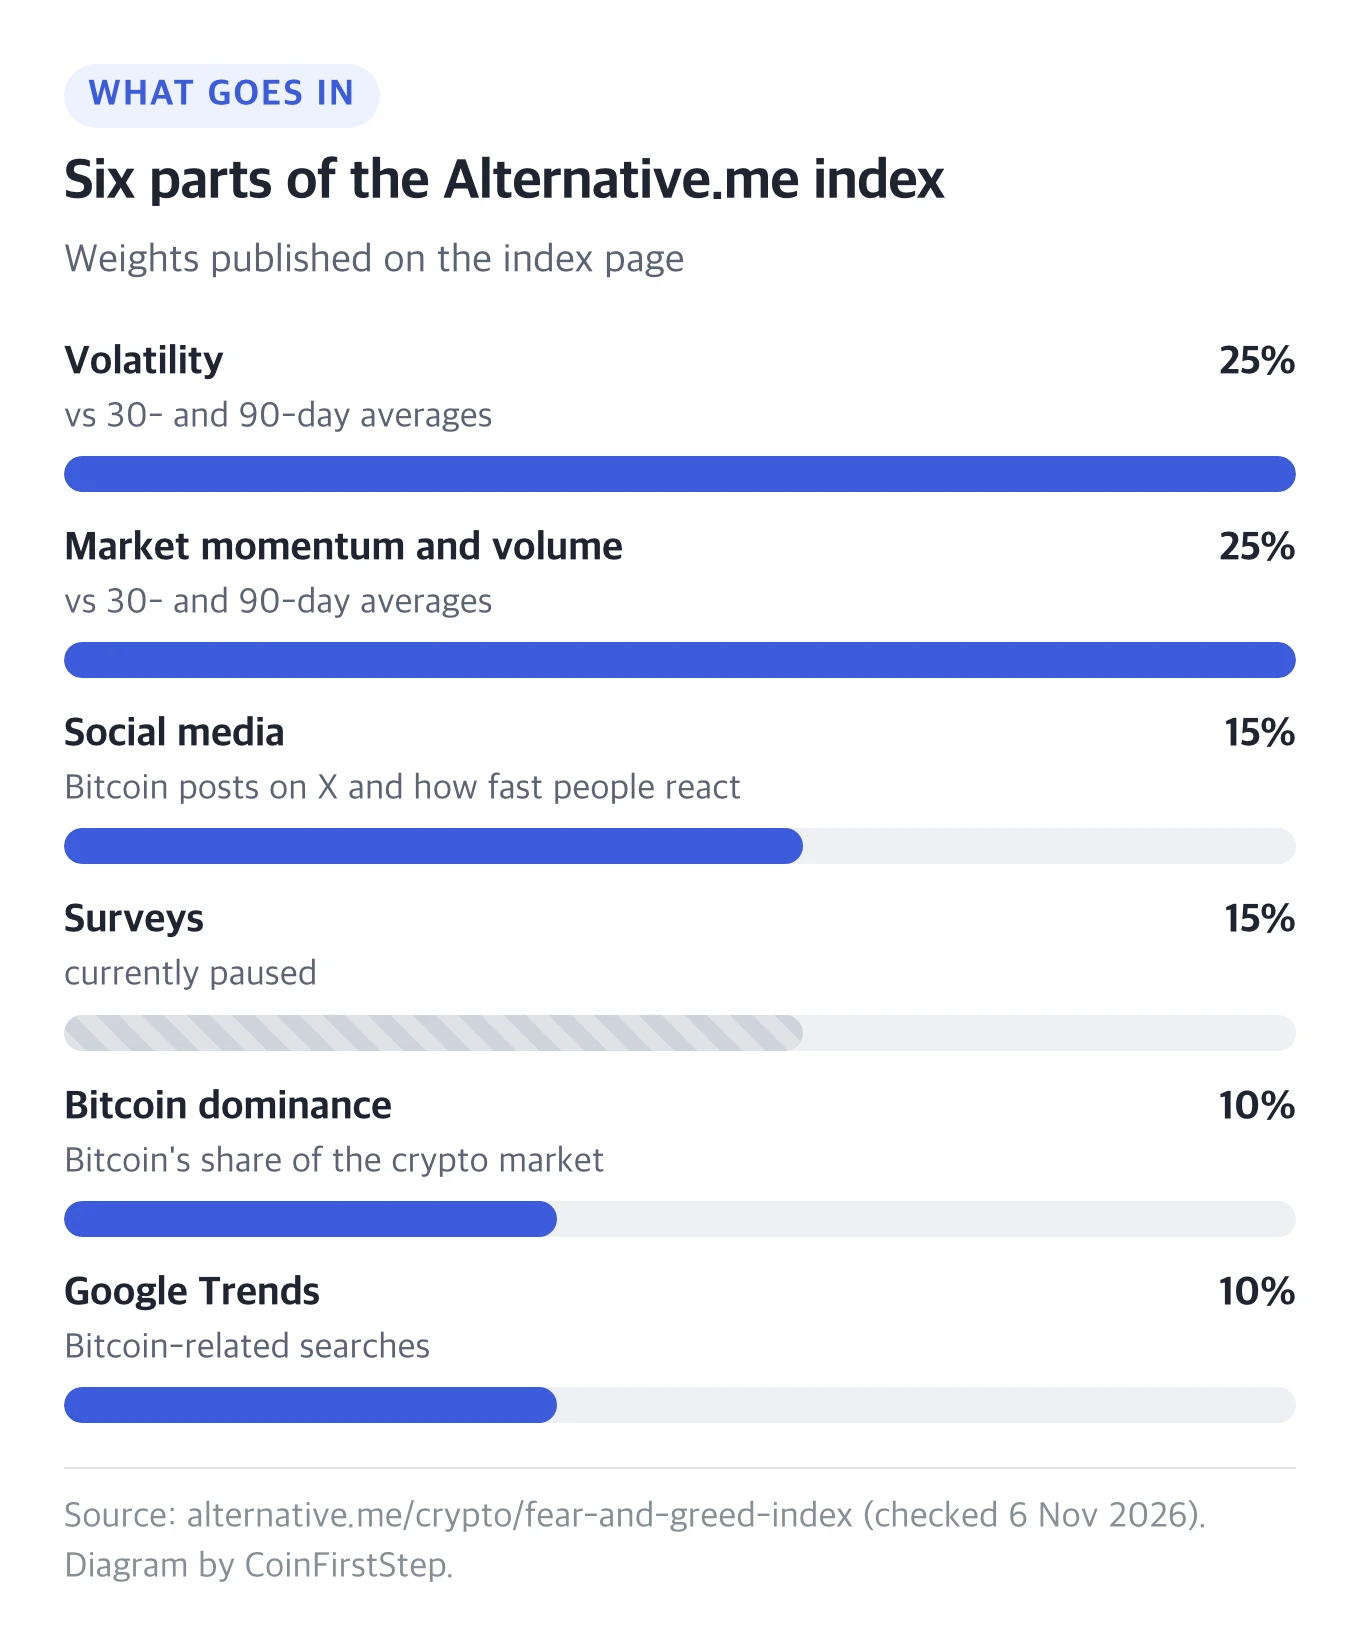
Volatility (25%) compares Bitcoin's current price swings and biggest drops with the 30-day and 90-day averages. Big swings push the score toward fear.
Market momentum and volume (25%) compares current momentum and trading volume with the same averages. Strong buying pushes it toward greed.
Social media (15%) counts posts on Bitcoin hashtags on X (Twitter) and how fast they get likes and replies. Unusually busy interaction pushes it toward greed.
Surveys (15%) came from weekly polls. Alternative.me lists this part as currently paused.
Bitcoin dominance (10%) is Bitcoin's share of the whole crypto market. Alternative.me reads rising dominance as fear (money leaving riskier altcoins) and falling dominance as greed.
Google Trends (10%) tracks changes in Bitcoin-related searches. Alternative.me's own example: a jump in searches for "bitcoin price manipulation" is a sign of fear.
4. Where to check the Fear & Greed Index
On Alternative.me. The index page at alternative.me/crypto/fear-and-greed-index shows today's score next to yesterday, last week and last month, with a chart of the full history.
In the Binance app. Binance offers a Fear & Greed widget for your phone's home screen. Binance's help page says the data comes from CoinMarketCap and is synced every 15 minutes. The small widget shows today's score, and the medium one adds yesterday, last week and last month.
If you're new to Binance, the step-by-step sign-up guide covers getting your account ready first.
The Binance widget and Alternative.me show two different indexes. CoinMarketCap's covers the largest coins, not just Bitcoin: it uses the top 10 coins' price momentum, Bitcoin and Ether options and volatility data, a stablecoin measure and CoinMarketCap's own search and engagement data. It doesn't publish its weights or its zone ranges. Here's how far apart the two were over a year:
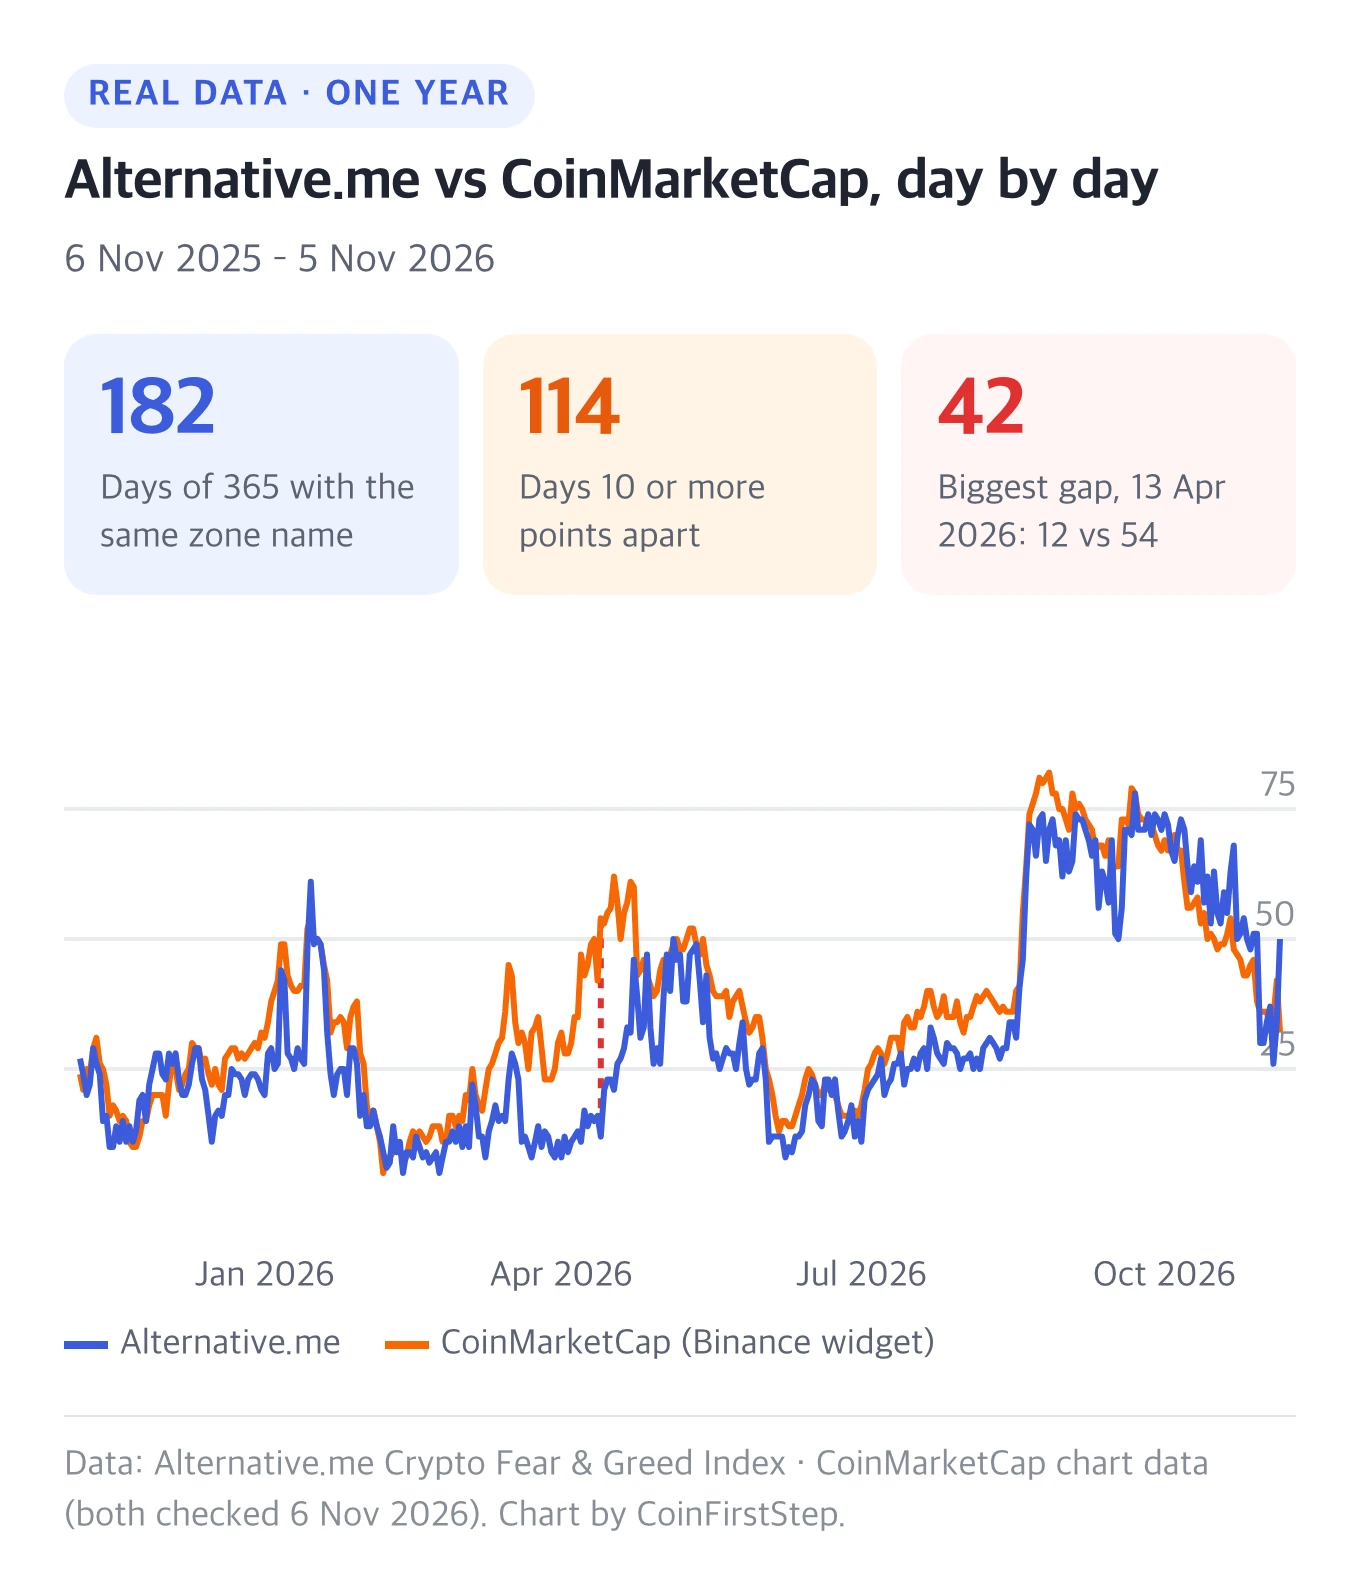
The two gave the same zone name on only half the days, and on April 13, 2026 one read 12 (Extreme Fear) while the other read 54 (Neutral). My habit is to stick to one index and compare today's number with that index's own history.
5. How to read the Fear & Greed Index
The chart below shows daily readings from November 6, 2025 to November 5, 2026 under the Bitcoin price.
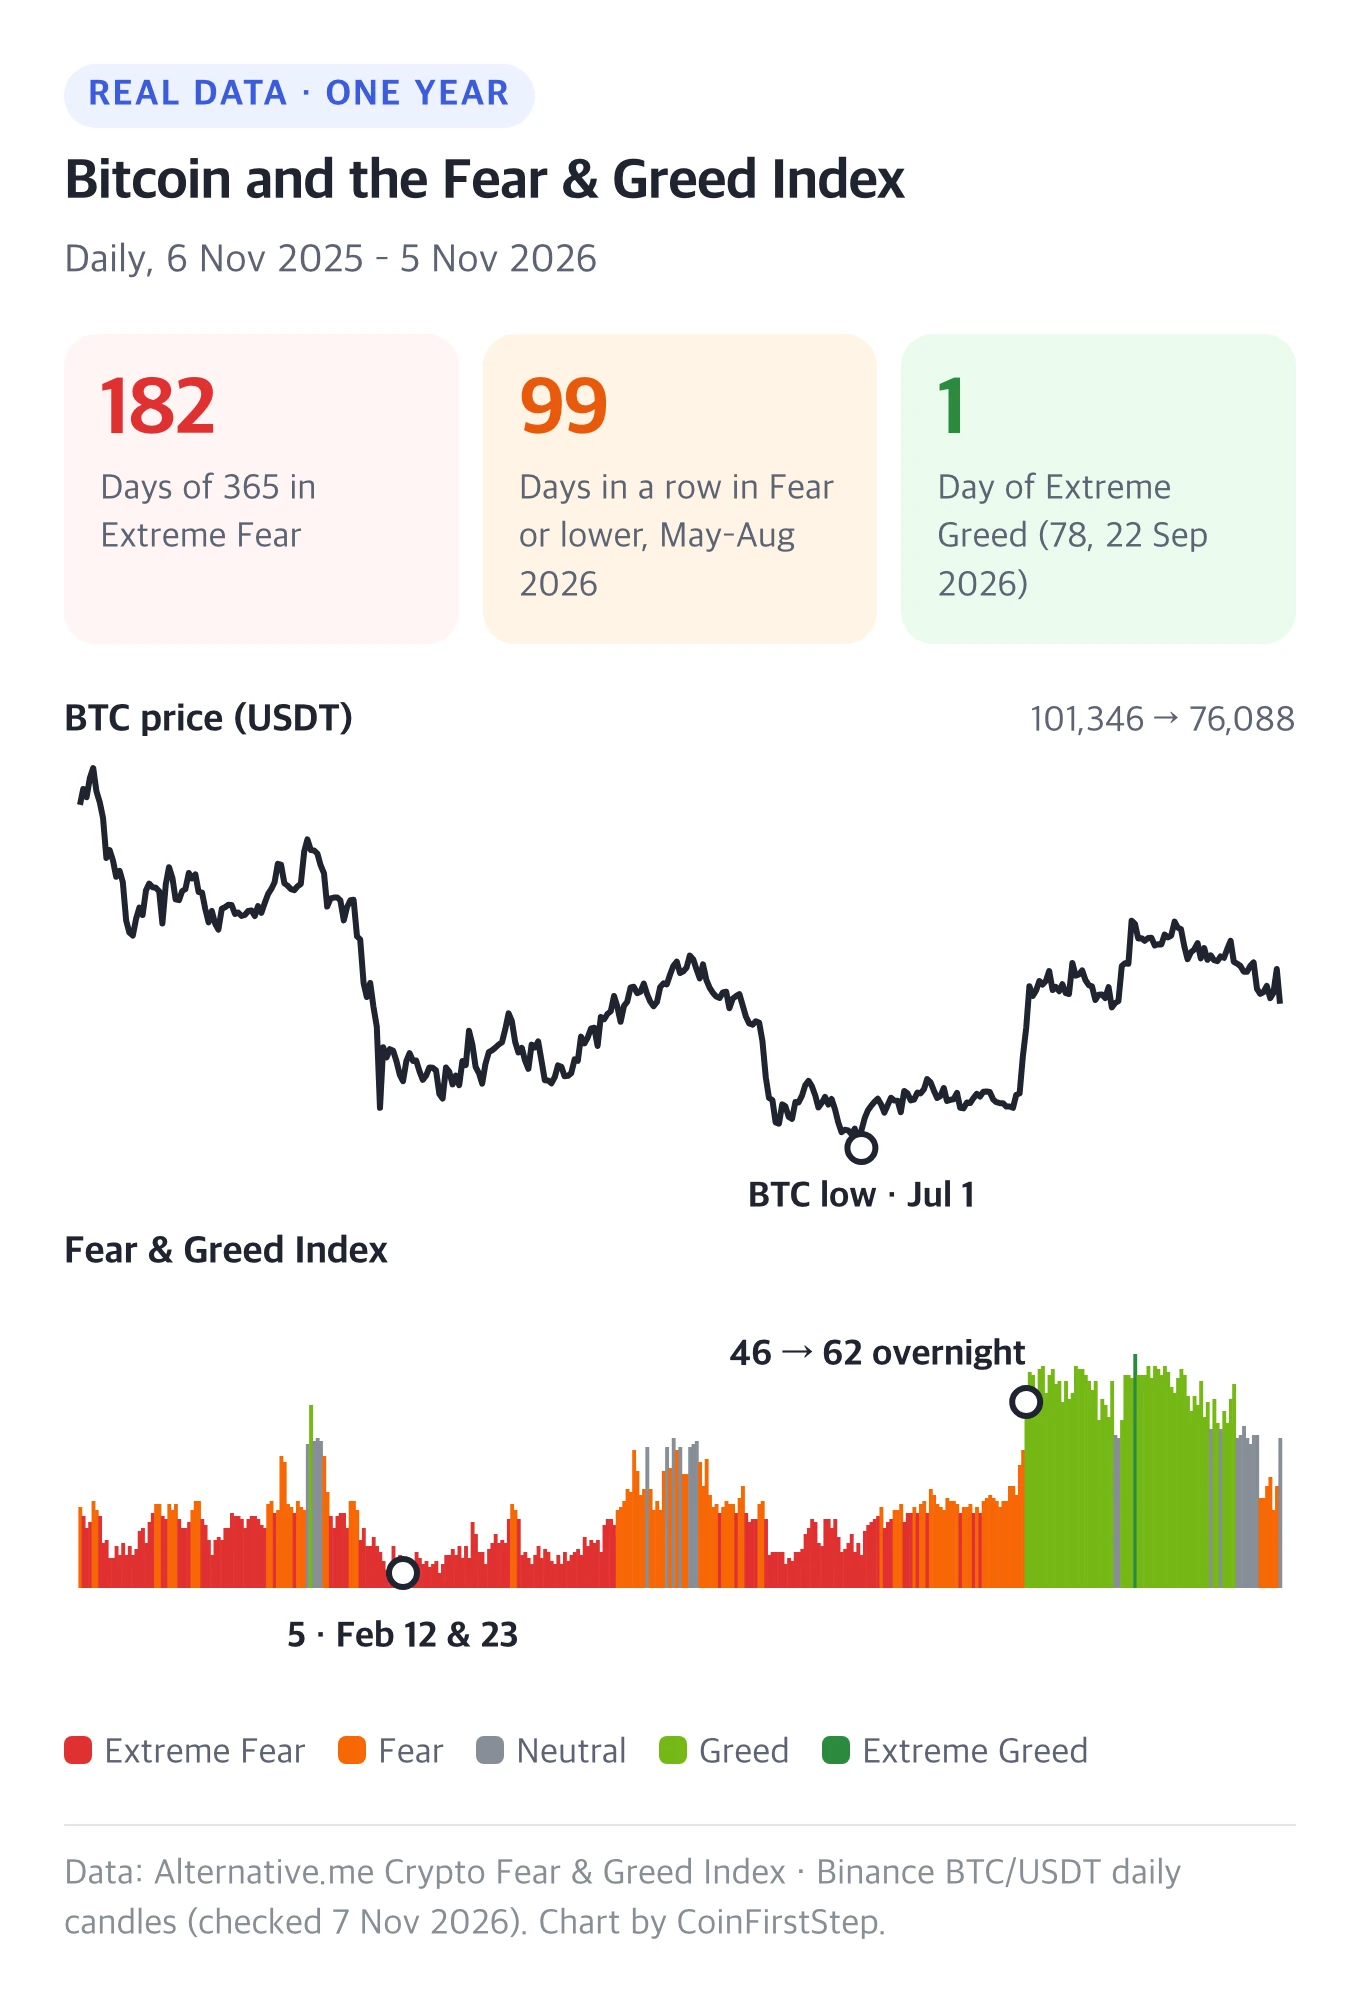
That year was unusually fearful: across the full record from February 2018 to November 5, 2026, 739 of 3,196 recorded days (about 23%) were Extreme Fear, compared with 182 of 365 in that year.
Three things stand out in this year of data:
The index followed the price. The score fell to 5 on February 12 and again on February 23, 2026, tying the lowest reading in its history (the only other 5 was on August 22, 2019). By then, Bitcoin had already fallen about a third from early November.
The lowest score didn't mark the lowest price. Bitcoin kept falling and hit its low for the year on July 1, 2026, when the index read 11. Around that low, the score stayed in Fear or lower for 99 days in a row, from May 13 to August 19.
Mood flips fast when the price moves. When Bitcoin rose about 13% in two days in late August 2026, the score jumped from 46 (Fear) on August 19 to 62 (Greed) on August 20.
A popular contrarian idea says extreme fear can come near a bottom. In this data that was only partly true, as the second point above shows. Some people treat extreme readings as a cue to pause and recheck their plan rather than act on emotion. That's a habit, not a signal.
Crypto prices are volatile, and you can lose money. This is an explainer, not investment advice.
6. Limits of the Fear & Greed Index
| It looks backward | Volatility, momentum and volume come from recent prices, so the score reacts after the market moves |
|---|---|
| It's about Bitcoin | Alternative.me's index doesn't measure individual altcoins |
| Part of it is paused | The survey part (15%) is listed as paused, so the score comes from the other five parts |
| Other sites differ | CoinMarketCap and others publish their own versions with their own inputs and zones |
If you also want to see who is behind a price move, CVD (cumulative volume delta) looks at actual buying and selling instead of mood.
7. Crypto Fear and Greed Index FAQ
What is a good Fear & Greed Index score to buy?
There isn't one. The score describes the mood, not the price you should pay. Section 5, How to read the Fear & Greed Index, shows why.
How often does the index change?
Alternative.me updates it once a day. The Binance widget syncs with CoinMarketCap's index every 15 minutes.
Why does Binance show a different number from Alternative.me?
The Binance widget uses CoinMarketCap's index, which is built from different data and uses different zones. Neither is wrong; they measure different things.
Does the index work for altcoins?
Alternative.me's index is built from Bitcoin data. Many altcoins move with Bitcoin, but the score doesn't measure any single altcoin.
That covers what the crypto Fear and Greed Index shows and how to read it.
Thanks for reading!